Project overview
The main objective was to build a model that can accurately forecast the number of likes on a new Instagram post. I defined an interesting story line: A business wants to advertise with someone who has the highest chance of getting the greatest number of likes. Therefore, the business needs an accurate model to decrease the risk of investing in the wrong person.

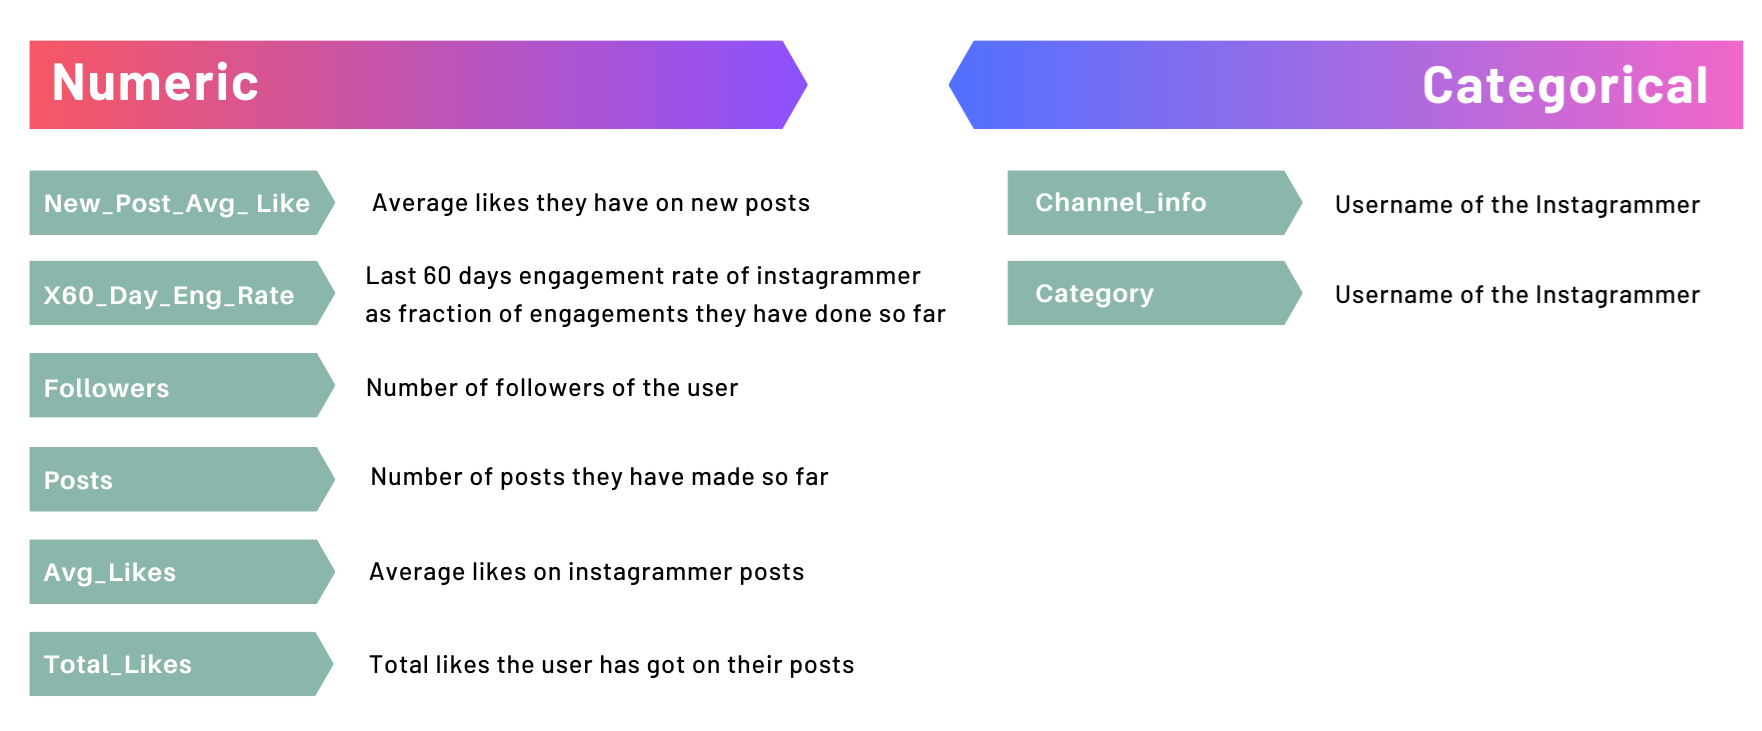
Data set
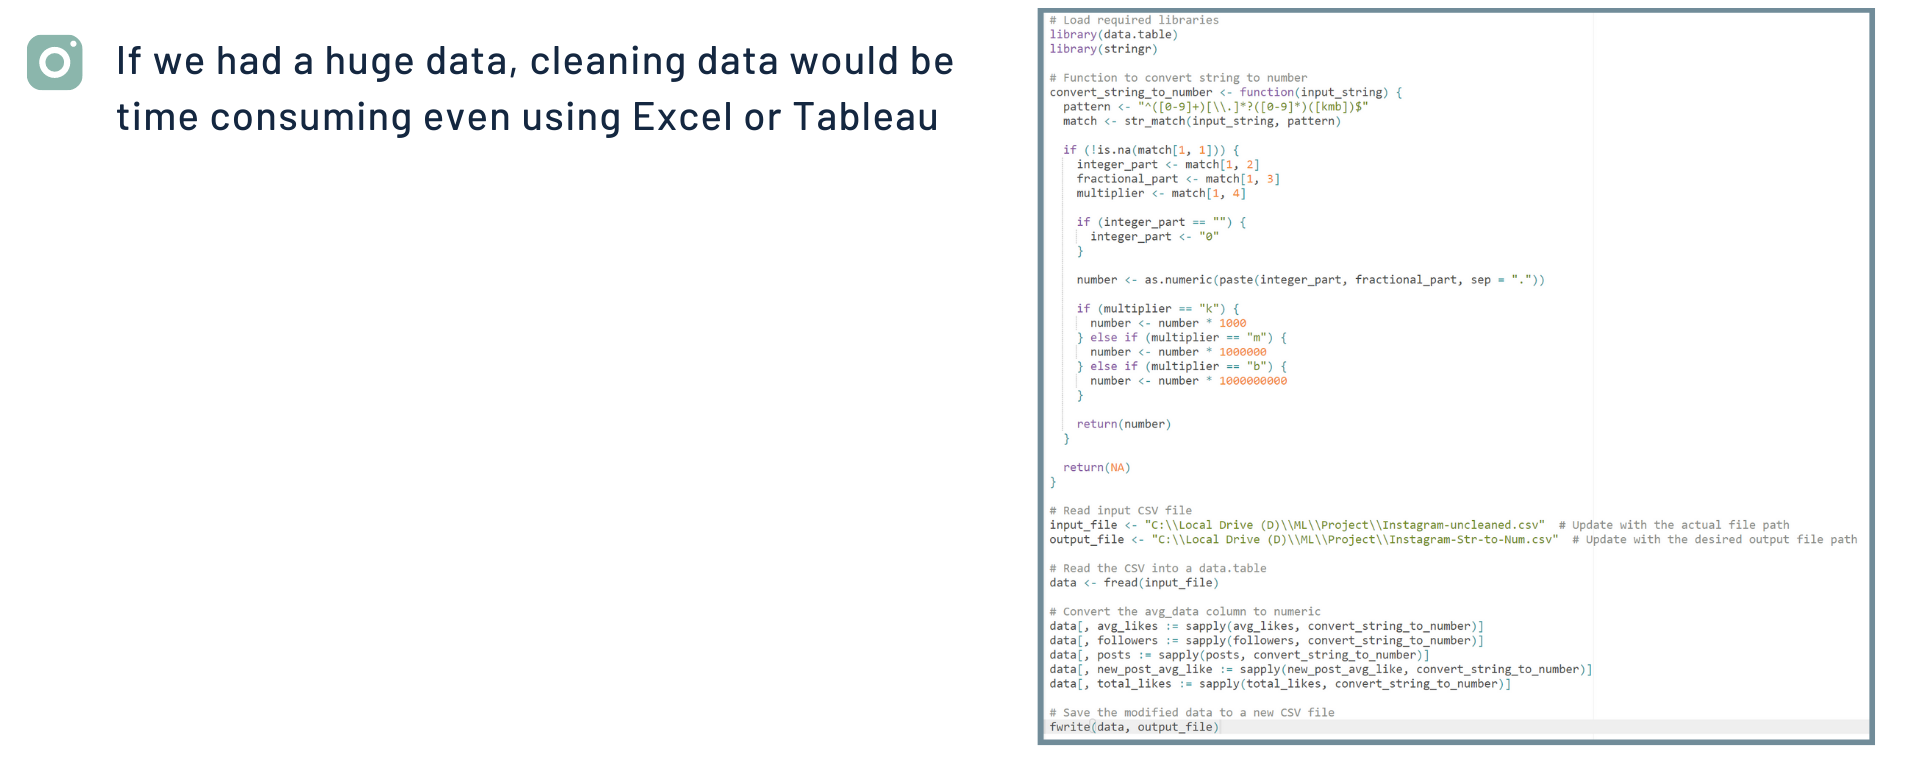
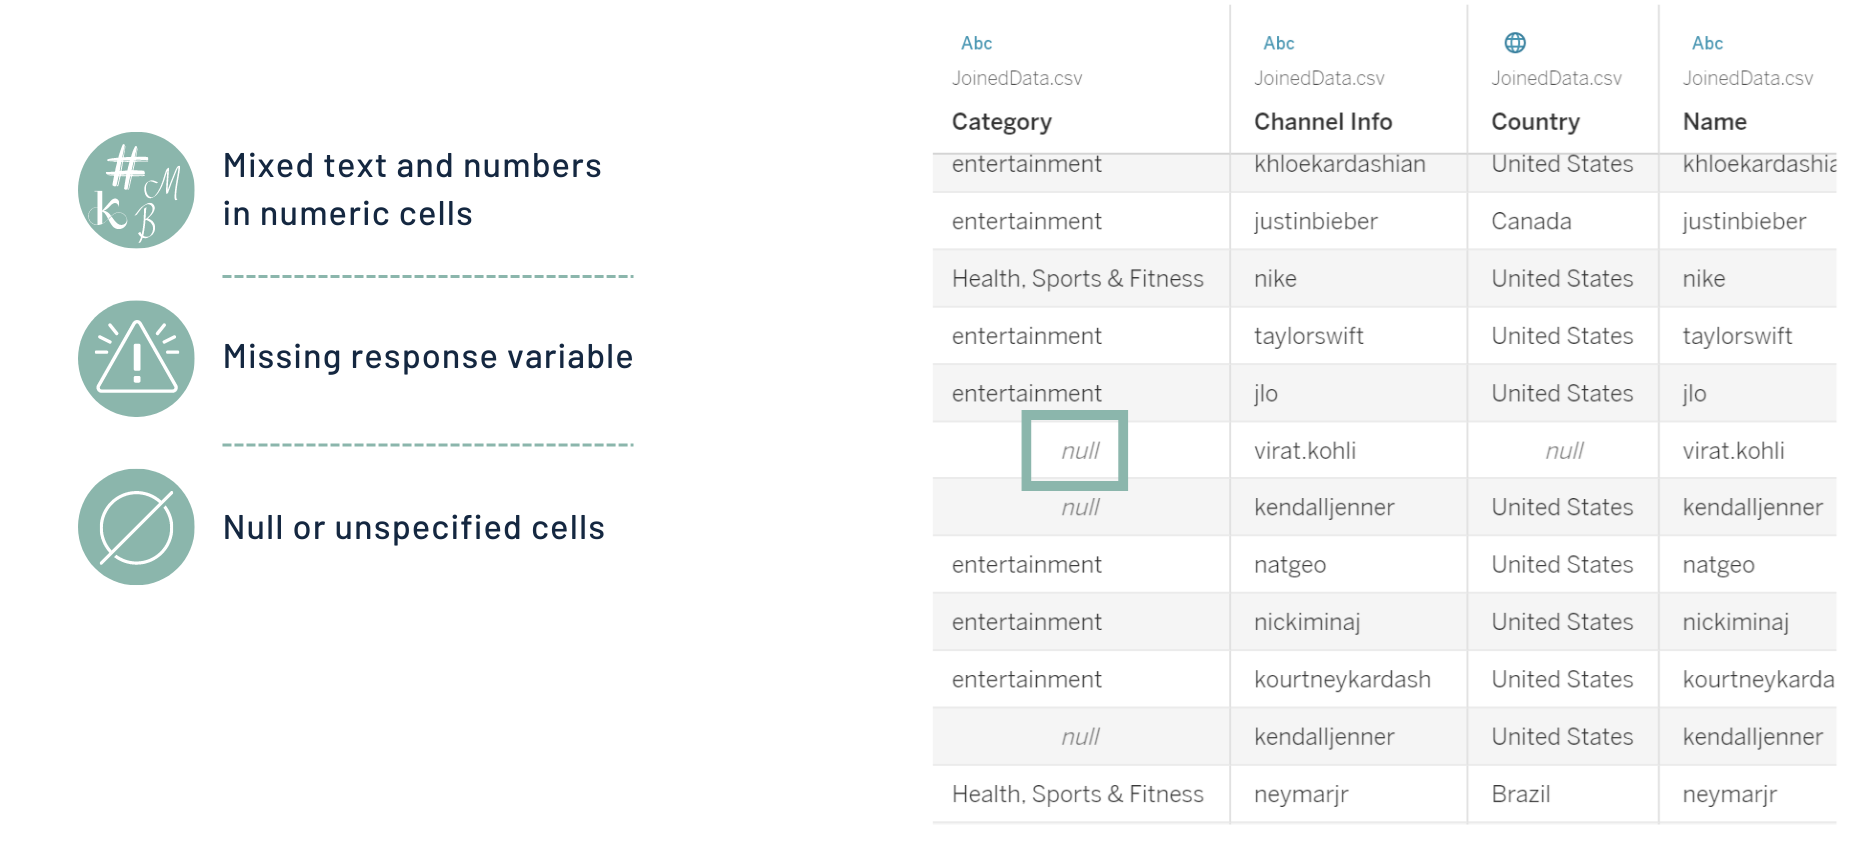
Data cleaning
My first challenge was to acquire real-world datasets. I searched through various websites, e.g., Kaggle and Tableau datasets, looking for datasets that included helpful information, such as engagement rate, number of posts, etc. The datasets I found had many issues like missing values, duplicate rows, and values with mixed numbers and characters. My next challenge was cleaning and preprocessing these data. I used R, Radiant and Tableau for this purpose. Finally, I joined two datasets to include all the relevant variables that I needed in my model.

Predicting average #likes for new posts
I applied linear regression and compared different combinations of variables to choose the best model.


Clustering
At this point, I got a good model with R2=0.86 with optimal number of variables and a nearly normal residuals distribution. However, I wondered if I could improve my results further by clustering the datapoints to extract different patterns. I used hierarchical clustering and applied linear regression on each of the clusters separately. At first, I considered all numeric and categorical variables.
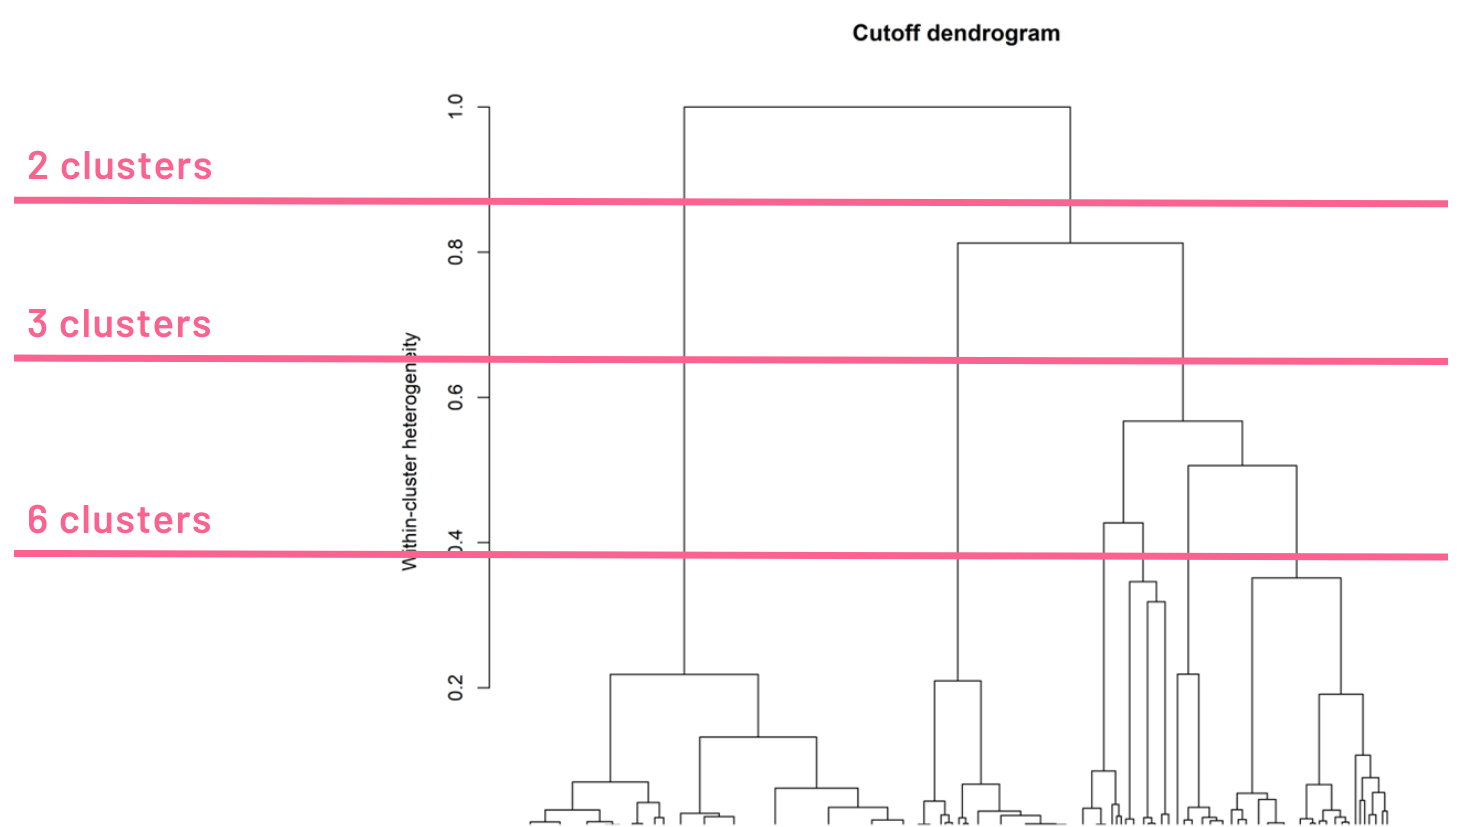


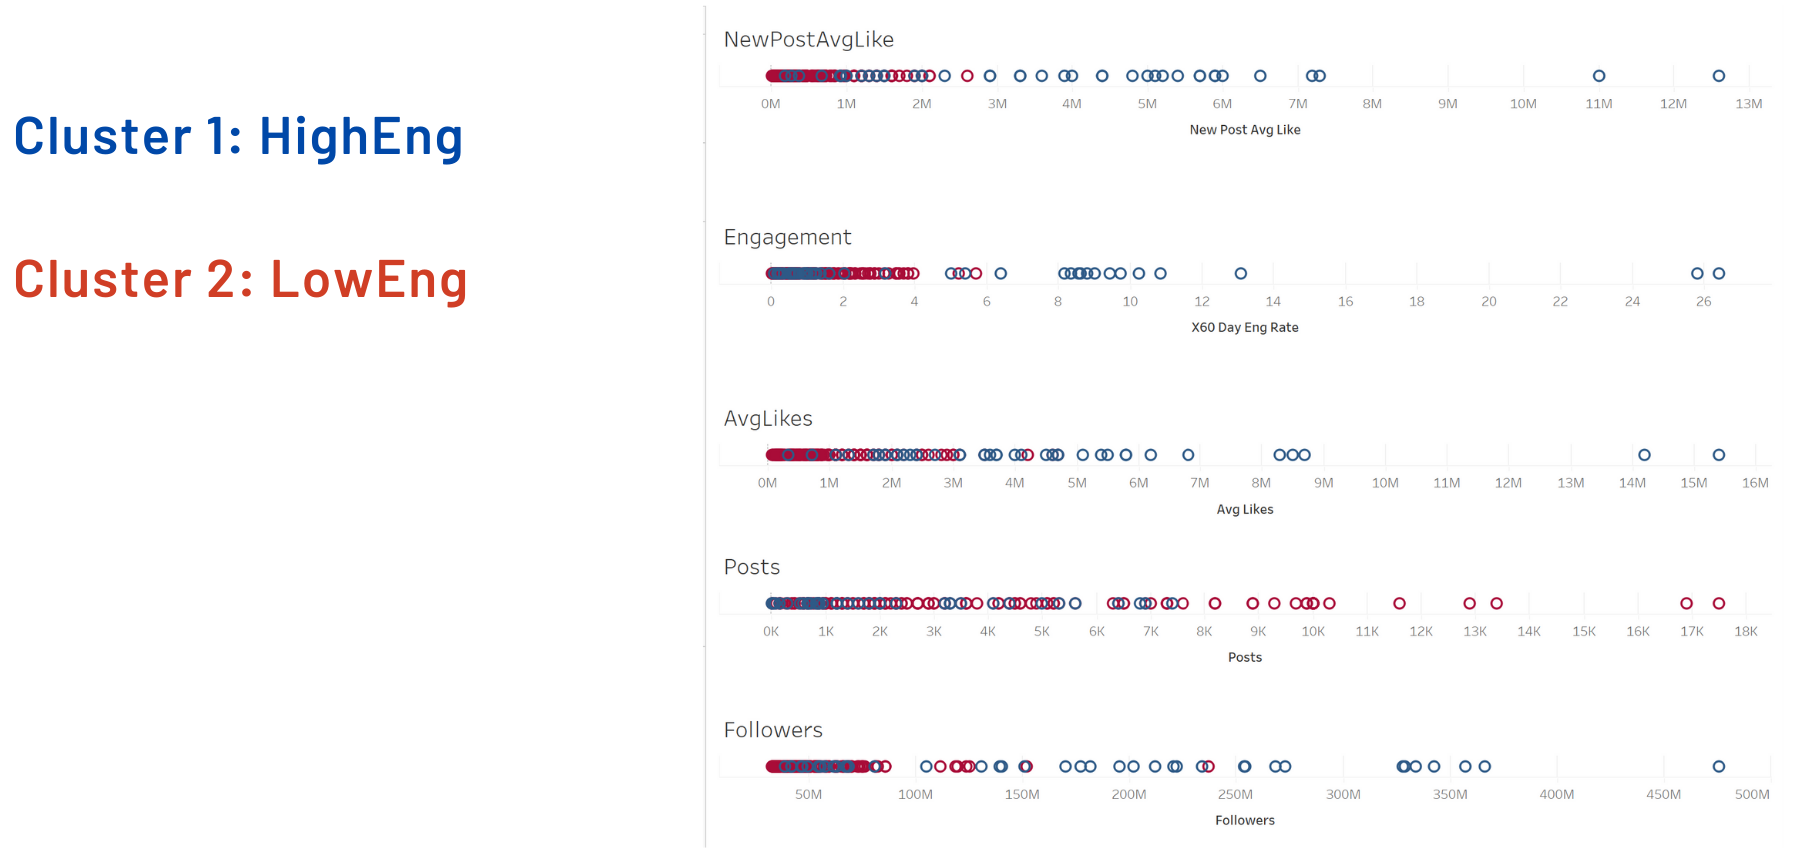
Since I couldn’t find any special meaning for each cluster with all variables, I decided to cluster data with only numeric variables. As a result, I could divide data to two clusters: Cluster 1: High Engagement rates and Cluster 2: Low Engagement rates. This is obvious in the visualization that I did by Tableau.


Regression in cluster 2 (LowEng)
I applied linear regression in cluster 2 and compared different combinations of variables to choose the best model.


Regression in cluster 1 (HighEng)
I applied linear regression in cluster 1 and compared different combinations of variables to choose the best model.

I observed that the R2 did not improve considerably, and thus, decided to keep my previous model to avoid extra overhead.
Predicting engagement rate of instagrammer
I thought using the engagement rate makes more sense for my story. Companies want their ads to be seen more, and the engagement rate is a better measure than just counting likes. So, I worked on predicting the engagement rate. Therefore, I did all these process for predicting engagement rate as output.


Example
I looked at 8 Instagram users with my model to fit my storyline. Guess what? Jennifer Aniston got the highest engagement rate!


However, my model doesn't always predict well, like you can see with Leo Messi.